
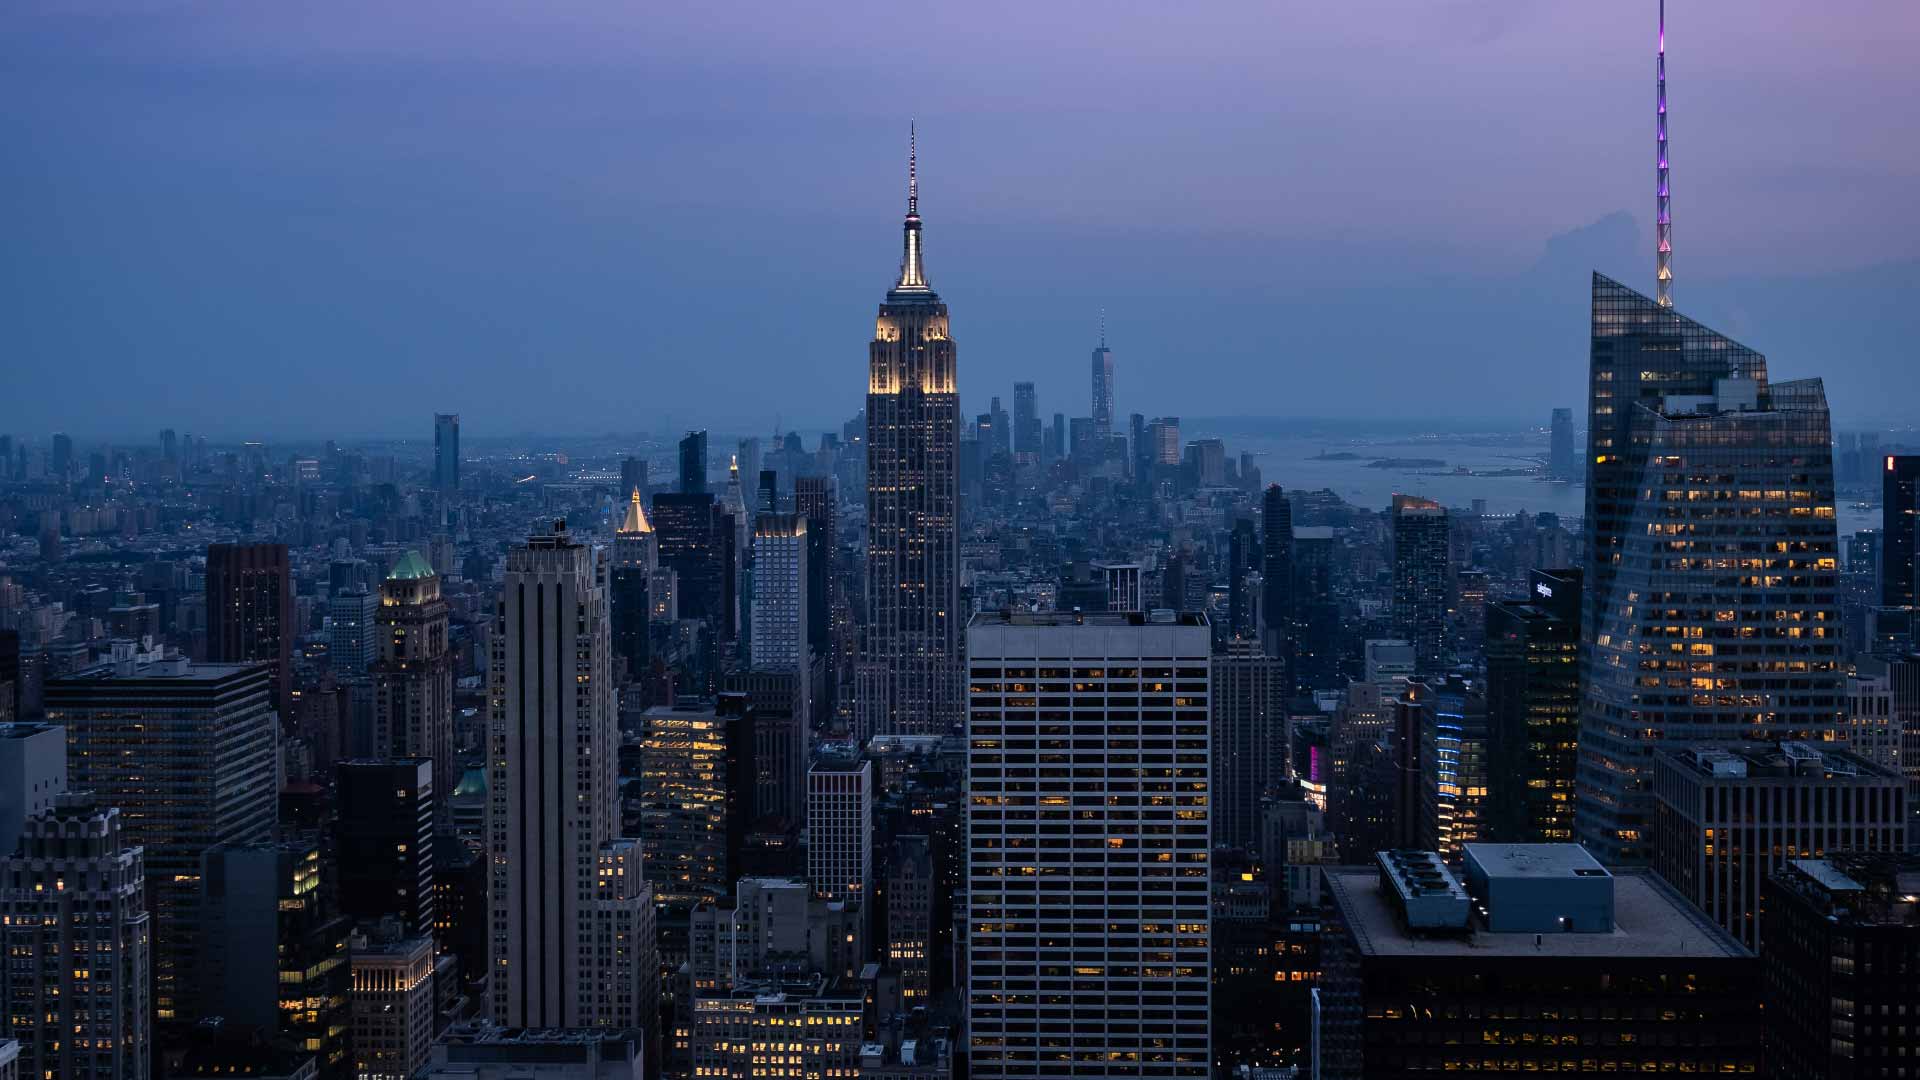
Manhattan’s office market continued its recovery through October 2026, characterized by declining availability, strengthening asking rents, competition for premium space, and increasingly limited opportunities in the most desirable buildings. The recovery has broadened beyond trophy properties, although substantial differences remain between Class A assets, well-positioned Class B buildings, and older, less competitive properties.
Leasing activity during the first nine months of 2026 was exceptionally strong. Availability contracted, while average asking rents climbed to their highest level in several years. The market is shifting from absorption of post-pandemic excess inventory toward greater supply constraints, especially in Midtown and select Midtown South locations. As the market continues to strengthen in the landlord’s favor, we encourage tenants with expiration dates within the next 12-24 months to begin exploring their options.
Even in today’s landlord-favorable market, we’re continuing to achieve outstanding results for our clients. Our experience and knowledge of the market, combined with creative thinking and an exclusive focus on tenant representation, give our clients a distinct advantage. Because we represent tenants only, our interests are never divided.
At Armano Real Estate, our focus is always on getting the best possible deal and delivering the strongest outcomes for the businesses we serve. We act as an outsourced corporate real estate resource; we provide the guidance, expertise, and advocacy our clients need to make smart real estate decisions. At the end of the day, our success is measured one client, one assignment, and one result at a time.
See below for information on current market conditions.
Key Market Indicators
| Indicator | Latest reported measure | Movement / context |
| Manhattan availability | 12.4% | Down 60 basis points quarter over quarter |
| Average asking rent | $78.36 / RSF | Up 4.6% year over year |
| Year-to-date leasing | 32.86 million SF | Up 9.3% year over year |
| Total available inventory | 64.76 million SF | Approximately 34% below post-pandemic peak |
Note: These are the latest third-quarter measurements available as of October 30, not a separately measured October month-end statistical release.
1 | Availability and Asking Rents by Submarket
| Market | Availability | Average asking rent / RSF | Annual rent growth |
| Midtown | 12.1% | $85.53 | +3% |
| Midtown South | 16.2% | $86.94 | +3% |
| Downtown | 15.9% | $62.40 | +8% |
| Manhattan overall | 13.7% | $80.40 | +4% |
Availability includes space marketed for lease, whether occupied or vacant. Vacancy typically measures unoccupied space. The two measures should not be used interchangeably.
2 | Individual Market Conditions
Midtown — Increasingly Landlord-Favorable
Midtown availability has returned close to pre-pandemic levels. Legal and financial services are major drivers of leasing activity, with notable strength in the Plaza District, Park Avenue, and renovated Class A buildings near transportation hubs. Competition for the highest-quality buildings is particularly intense.
Midtown South — Technology-Driven Demand
Midtown South recorded approximately 4.75 million SF of third-quarter leasing activity, reflecting exceptional demand from AI and technology-related firms. Hudson Square and other creative office districts continue to attract growth-oriented occupiers. Well-located Class B properties remain competitive when their layouts and economics are attractive.
Downtown — Improving Conditions and Relative Value
Downtown continues to offer a substantial rental discount to Midtown. One market survey measured Downtown availability at 15.2% and average asking rent at $64.88 / RSF, up 9.7% annually. The market continues to benefit from shrinking available inventory and the repositioning or conversion of obsolete office properties.
3 | Significant Transactions and Market Headlines
| Property / Tenant | Transaction | Market significance |
| 330 Hudson Street / Anthropic | Approximately 466,000 SF | Large AI-sector commitment in Midtown South |
| 11 Times Square / Proskauer Rose | Approximately 478,000 SF renewal and expansion | Major law-firm commitment to Midtown |
| 28–40 West 23rd Street / Ramp | Reported 175,000 SF lease | Late-October fintech demand in Midtown South |
| 3 Times Square / JAMS | Reported 55,335 SF lease | Continued demand for centrally located Midtown office space |
4 | Major Market Trends
Premium Building Supply Is Exceptionally Tight
Direct availability in Midtown trophy properties was reported at approximately 2.4%, while a separate prime-property survey reported 1.9% vacancy. Although these measure different sets of buildings, they illustrate how limited the highest-quality options have become. Conditions can differ sharply for a tenant seeking modern infrastructure and large contiguous blocks versus a tenant with more flexible requirements.
Sublease Inventory Is Contracting
Manhattan sublease supply declined approximately 12.1% during the third quarter to 10.6 million SF, its lowest level since 2019. Fewer discounted sublease alternatives can improve landlords’ leverage over direct-lease negotiations.
Office-to-Residential Conversions Are Reducing Future Office Supply
Approximately 17.6 million SF of office-to-residential conversion projects are active or planned, in addition to roughly 5.6 million SF converted since 2020. Planned projects are not yet completed supply reductions, but the pipeline is an important long-term factor, especially Downtown and in older properties.
Office Attendance Has Improved
Local weekday office attendance in September was estimated to be approximately 15% below pre-pandemic levels, compared with roughly 30% below nationally. Manhattan’s relative strength supports improved utilization and leasing demand, even though attendance remains below 2019 levels.
5 | Tenant Strategy and Negotiating Implications
| Tenant requirement | Principal market implication |
| Trophy / premium Class A | Limited inventory and stronger landlord leverage |
| Midtown Class B | Selective opportunities; building quality and ownership matter |
| Midtown South creative | Demand from technology and growth-oriented firms |
| Downtown Class A / B | Often substantially more favorable pricing than Midtown |
| Renewals | Early analysis of both in-place and relocation economics |
| Large contiguous space | Longer lead times and earlier planning |
Begin the decision-making process early. Tenants with 2027–2029 lease expirations should evaluate relocation and renewal well ahead of maturity, particularly when extensive construction or technology work will be required.
Understand building-specific motivations. Manhattan is not uniformly landlord-favorable. Buildings with meaningful vacancy, upcoming rollover or capital requirements may still provide exceptional negotiating opportunities.
Compare complete occupancy economics. Net effective rent and tenant cash obligations, rather than asking rent in isolation, should drive the financial comparison between competing properties and renewal alternatives.
6 | Outlook for the Remainder of 2026
Manhattan is likely to experience continued pressure on the supply of high-quality office space, with performance differing substantially by asset class and submarket. Supportive factors include leasing demand, sublease absorption, financial and technology company expansion, a limited new-development pipeline, and conversions removing older office inventory.
Risks include weaker corporate hiring, slower economic growth, capital constraints affecting older properties and rising occupancy costs. Despite the stronger market, attractive opportunities remain for tenants whose representatives can identify ownership-specific financial pressures and negotiate the full lease economics.
Bottom Line
Manhattan office availability is tightening and asking rents are rising, but significant opportunities remain for tenants who plan early. Understanding the financial position of individual buildings and negotiating the complete transaction rather than focusing only on face rent are the keys to success.